
Quarterly Economy & Travel Industry Summary
A Reminder to Expect the Unexpected
- Tailwinds primed to lift the economy in 2026 were counterbalanced by the outbreak of conflict with Iran.
- The Iranian conflict has notable economic consequences, most obviously on energy prices, including gasoline.
- Headwinds from the conflict with Iran prompted us to reduce our 2026 Gross Domestic Product growth forecast from 2.8% to 2.4%.
As the year began, the tariff situation appeared to have largely stabilized, inflation was expected to ease, and tax returns inflated by provisions in last year’s One Big Beautiful Bill Act would support growth in consumer spending. The OBBBA also included incentives to encourage business investment, broadening business spending beyond last year’s narrow focus on artificial intelligence-related projects.
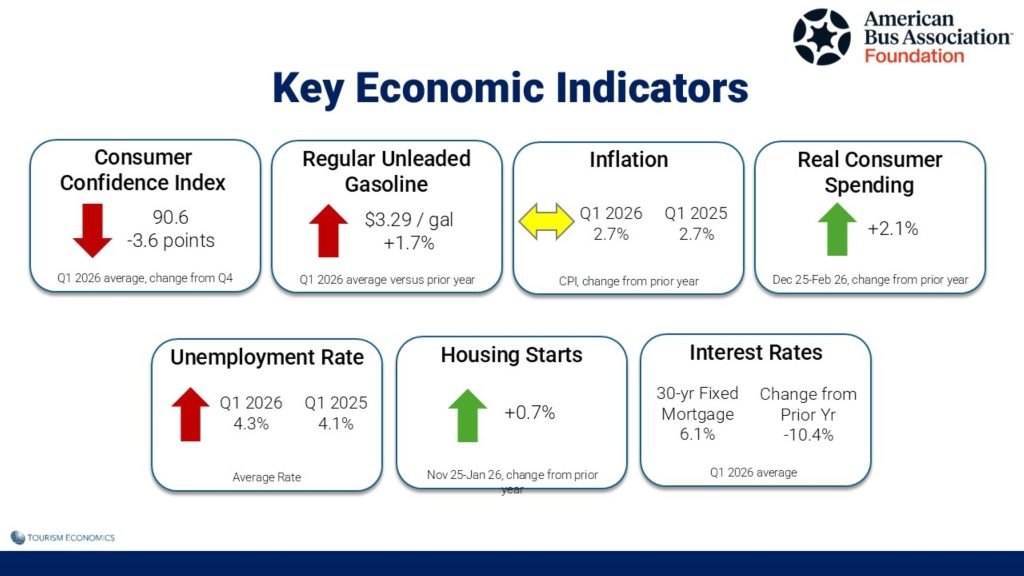
The optimism of January and February feels like a fading memory, overshadowed by the conflict in Iran that began on February 28. The unexpected conflict has generated notable economic consequences, most obviously on gas prices. The price of regular unleaded gasoline surpassed $4 per gallon in March, versus an average of $2.96 per gallon in January.
The spike in energy prices had an eye-opening impact on headline inflation, just as tariff effects were shrinking in the rearview mirror. March’s 0.9 percent jump in the Consumer Price Index (CPI) – the biggest since 2022 – was driven by energy. The current oil spike has yet to reverberate meaningfully into broader inflation, but that won’t hold for long. Elevated fuel costs are beginning to seep into transportation, food, and beyond, suggesting broader price pressures are just getting started.
With gas prices still elevated, the April CPI is likely to stage another sizeable increase, and the lagged impact of higher energy prices on other goods and services is poised to kick in. Food prices were unchanged in March, but that will not repeat in April as the increased cost of transportation and fertilizer is about to feed through to the grocery aisles.
Until recently, household purchasing power has held up quite well despite slowing job and wage growth, as real earnings continued to increase at a decent rate. But the price spike in March marks a dramatic inflection point, as it took a major bite out of worker paychecks. The annual increase in real earnings last month plunged from 1.3 percent to 0.3 percent, meaning workers are barely keeping abreast of inflation.
What’s more, the savings buffer is also deflating, as the personal savings rate slipped from 4.5 percent to 4.0 percent in February, which is well under the 6 percent average since 2000.
For blue-collar workers, the squeeze on purchasing power is even worse, as real earnings for nonmanagement workers inched up by a mere 0.1 percent over the past year. True, the income-sapping price spike was heavily skewed by the oil surge, while most other prices were unaffected. But it’s important to remember that energy costs take up a larger share of lower-income budgets than they do of better-paid workers’ budgets, so this cohort was hit the hardest and will face difficult trade-offs, including cutting back on discretionary spending.
To be sure, any pullback by lower-income workers could be cushioned by wealthier households, who have powered most of the consumption growth in recent years, thanks to booming stock portfolios. But should the Mideast crisis – or any unforeseen shock – prompt a major stock market correction, that wealth effect would evaporate, removing a key pillar keeping the economy afloat. So far, the markets have held up reasonably well, albeit with increased volatility and some steep daily losses when things looked dire.
As it is, the consumer was not riding a wave of momentum even before the oil shock hit the headlines. Personal spending growth rose 0.5% in February, or just 0.1% after adjusting for prices, following a near-stall in January due to extreme winter weather. The weaker-than-expected rebound in February spending was notably disappointing as it pre-dates the start of the war with Iran, raising the risk that spending in Q2 falls short of expectations once the hit from higher gasoline prices hits consumers. Also, there was some tentative evidence that upper-income households, who have been driving overall spending, may be pulling back a bit as volatility in financial markets increased.
Consumer spending was anticipated to gain some momentum from larger-than-usual tax returns thanks to provisions in last year’s fiscal bill. However, much of the increase will now be absorbed by higher gas prices and other price increases, negating much of the expected benefit.
Higher inflation and the corresponding impact on real incomes prompted us to reduce our 2026 Gross Domestic Product growth forecast from 2.8% at the beginning of the year to 2.4%.
With pressure on inflation from higher energy prices building, the odds of the Federal Reserve cutting rates soon have diminished. But signs of demand destruction are becoming more visible, which will test the Fed’s patience the longer the Mideast crisis drags on. Consumer sentiment plunged to an all-time low in early April, and while the correlation between sentiment and spending has weakened in recent years, consumers are already behaving very defensively based on a tangible hit to their purchasing power. Assuming the ceasefire holds and leads to a durable solution, we believe the Fed will look through the oil-induced inflation shock and resume cutting rates later this year to prevent the nascent demand destruction from morphing into a recession.
Signs of an Upswing in Travel in the First Quarter of 2026
- Air travel, hotel stays, and international arrivals all experienced periods of growth in the first quarter.
- The cruise industry continues to grow in the US.
- The impact of the conflict in Iran on the travel industry is still to be determined.
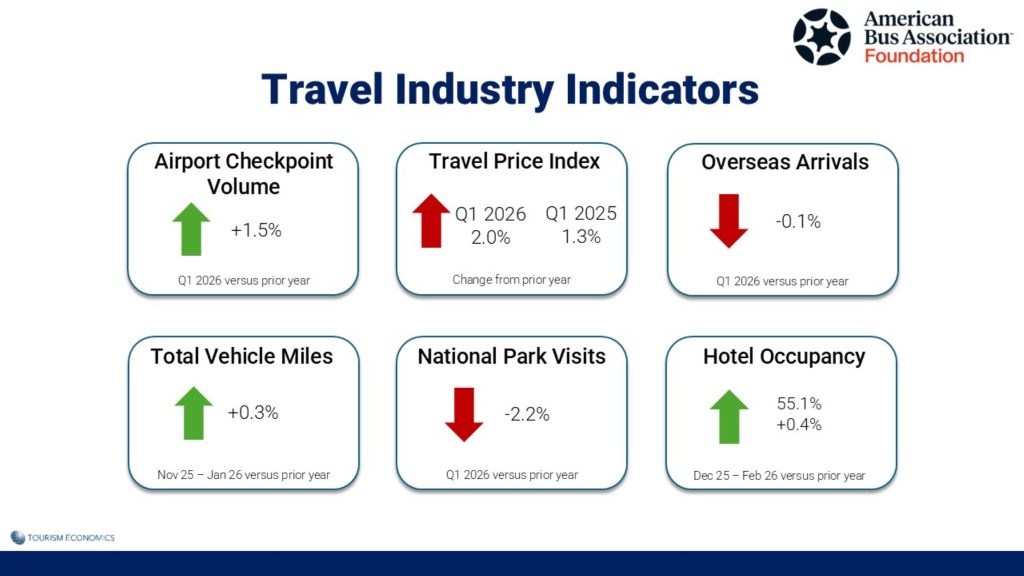
Key travel indicators posted encouraging growth in the first quarter of 2026. TSA checkpoint volume, a gauge of airline travel based on the number of passengers screened at TSA security points in US airports, rose 1.5% in the first quarter. While checkpoint volume was essentially flat (0.1%) in January, possibly due to severe winter storms in parts of the country, it grew 2.7% in February and 1.7% in March compared with the same month last year.
Hotel performance has followed the same pattern as TSA checkpoint volume at the start of 2026. Demand was up just 0.5% in January, but rose 2.9% in February, and preliminary March data suggest another healthy gain is likely.
Following nine consecutive months of decline, overseas visitor arrivals finally turned positive in February. Overseas arrivals rose modestly by 0.8% in February and increased by a healthy 3.6% in March. However, these results were influenced by holiday shifts, as the Lunar New Year fell in February this year, rather than January last year. Additionally, the earlier Easter date, April 5, rather than April 20 last year, may have shifted some travel into March.
Although overseas arrivals grew in February and March, a decline in January left total first-quarter arrivals essentially flat compared with last year.
More than half of the 20 largest overseas origins grew in the first quarter of 2026 versus the same period last year. Among the 20 largest origins, Colombia (+31.9%) and Ecuador (+22.2%) posted the strongest year-over-year growth in the first quarter. Arrivals also grew from Asian origins, including Taiwan (+18.6%) and Japan (+6.2%), and from the European countries of Spain (+11.9%) and the United Kingdom (+4.6%). On the other hand, arrivals from several European countries declined in Q1, including Germany (-1.9%), France (-8.1%), the Netherlands (-12.9%), and Switzerland (-13.2%). India posted the largest first-quarter decline (-16.1%) among the top 20 origins.
Although the growth in February and March arrivals was encouraging, it represents only a partial recovery from last year’s decline in overseas visits. First-quarter overseas arrivals this year were 3.3% below the same period in 2024 and 15% below the pre-pandemic benchmark set in 2019. In short, overseas visits to the US have a long way to go to recover last year’s declines and face an even longer road back to pre-pandemic levels.
While overseas arrivals posted gains in February and March, the pattern of steep declines in arrivals from Canada continued in the first quarter of 2026. After dropping 25% last year, Canadian arrivals to the US were down nearly 15% in the first quarter of 2026.
On a positive note, the US is well-positioned to benefit from ongoing growth in the cruise industry. US ports are the primary beneficiaries of the cruise industry’s expansion, with passenger capacity deployed to US ports projected to increase by more than 8% in 2026, compared to 4% globally.
Miami stands out as a key beneficiary, driven by a higher frequency of shorter itineraries, while Los Angeles is benefiting from increased cruise deployment in the region.
It is too early to assess the impact of the Iranian conflict on the travel industry. Historically, the industry has observed that higher gas prices don’t cause a significant downturn in travel. An increase in gas prices represents a relatively small share of the overall cost of a trip, including accommodations, food, entertainment, etc. Rather than not traveling at all, travelers have tended to offset higher gas prices through reduced spending in other parts of their travel budget.
However, there is a reason to question if this time will be different. Consumers remain quite sensitive to higher prices after years of elevated inflation, dating back to the post-pandemic peak of 9% inflation in mid-2022. Household budgets for many middle- and lower-income families remain strained, reflecting what’s come to be known as the bifurcated, or “K-shaped,” economy. An inflationary surge driven by higher gas and energy prices could be enough to push these travelers to the sidelines.
The travel industry is also watching to see what impact, if any, the conflict in Iran has on outbound travel by US residents. A downturn in US outbound trips would be notable after several years of record-setting international travel by US residents. International travel by US residents rose 2.7% in 2025 despite tariffs, trade policies, and negative rhetoric by the Trump Administration that weakened international sentiment towards the US
The surge in US outbound trips since the pandemic, coupled with the slow return of international arrivals to the US and, in 2025, the further decline in international arrivals, has been a contributing factor to very weak growth in US hotel demand in recent years. Outbound travel by US residents in 2025 was 10% higher than in 2019, and overseas trips (excluding to Canada and Mexico) were 25% higher than in 2019. In contrast, international visitors to the US remain about 10% below the 2019 pre-pandemic benchmark.
A downturn in US outbound trips could reflect a shift in travel patterns towards domestic destinations, which would benefit the domestic travel industry, including hotels and short-term rentals. Significant events, including the FIFA World Cup, America 250 celebrations, and the 100th anniversary of Route 66, may also contribute to a shift towards domestic travel this year.
The Quarterly Economy & Travel Industry Summary partners with Tourism Economics, an Oxford Economics company. Combining rigorous economic analysis with decades of travel industry expertise, Tourism Economics is an industry-leading source of insights. Learn more at www.tourismeconomics.com.